Images can be a succinct and effective way to convey a message. Yet I don’t see many illustrations being used in technical communications. Many writers—including me—don’t think their strength is illustrating.
Dan Roam, in his book The Back of the Napkin, argues that one doesn’t have to be a gifted artist or use Adobe Illustrator or Microsoft PowerPoint to create effective images. Drawings can be as simple as hand-drawn pictures, he says. Indeed, his book is brimming with drawings that resemble doodles. One of my favorite things about Roam’s book is that he offers a framework that helps readers think about how to approach illustrating.
Here are some of the drawings he discusses:
- Portraits: To explain a concept that addresses the “who” or “what,” Roam recommends using a qualitative diagram. For example, many people struggle with understanding the term “metadata.” You could try to define it (such as “it’s data about data.”) But that definition often leaves people still scratching their heads. An alternative solution—you could draw it.
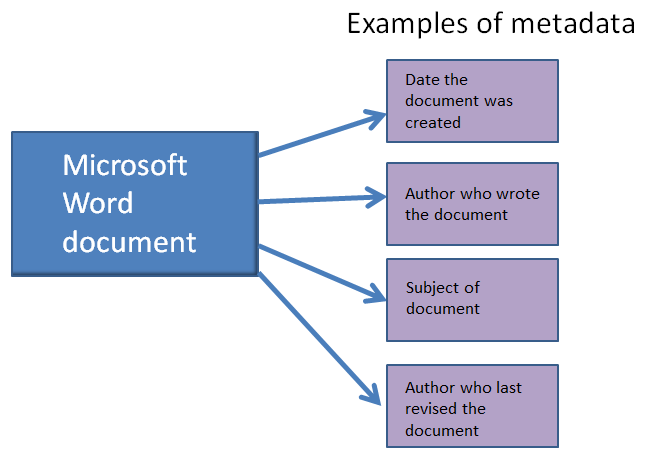
In short, metadata provides more details about a document, such as who wrote the file, when the person wrote it, the point of the document, and so on.
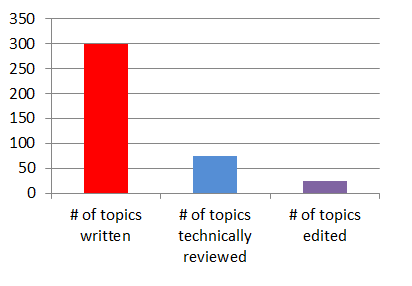
- Charts: If you’re trying to communicate a quantity, writing about it may suffice. But if you’re performing a comparison, a pie chart or bar chart is the best choice. Here’s a fictitious example:
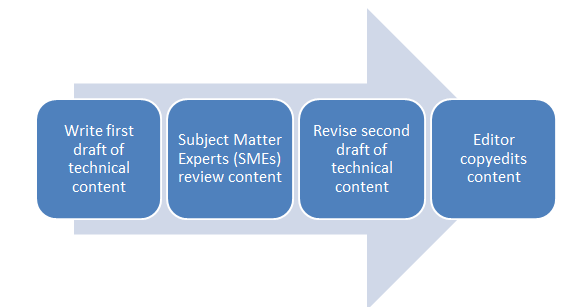
- Timelines: To explain a process or workflow, you could try explaining each step. Another way to accomplish the same thing is by using a simple workflow diagram, which explains “when” something happens in a process. For workflows, I frequently use Microsoft Office’s SmartArt feature. Here’s a sample workflow I created that conveys a commonly used approach to creating technical documents:
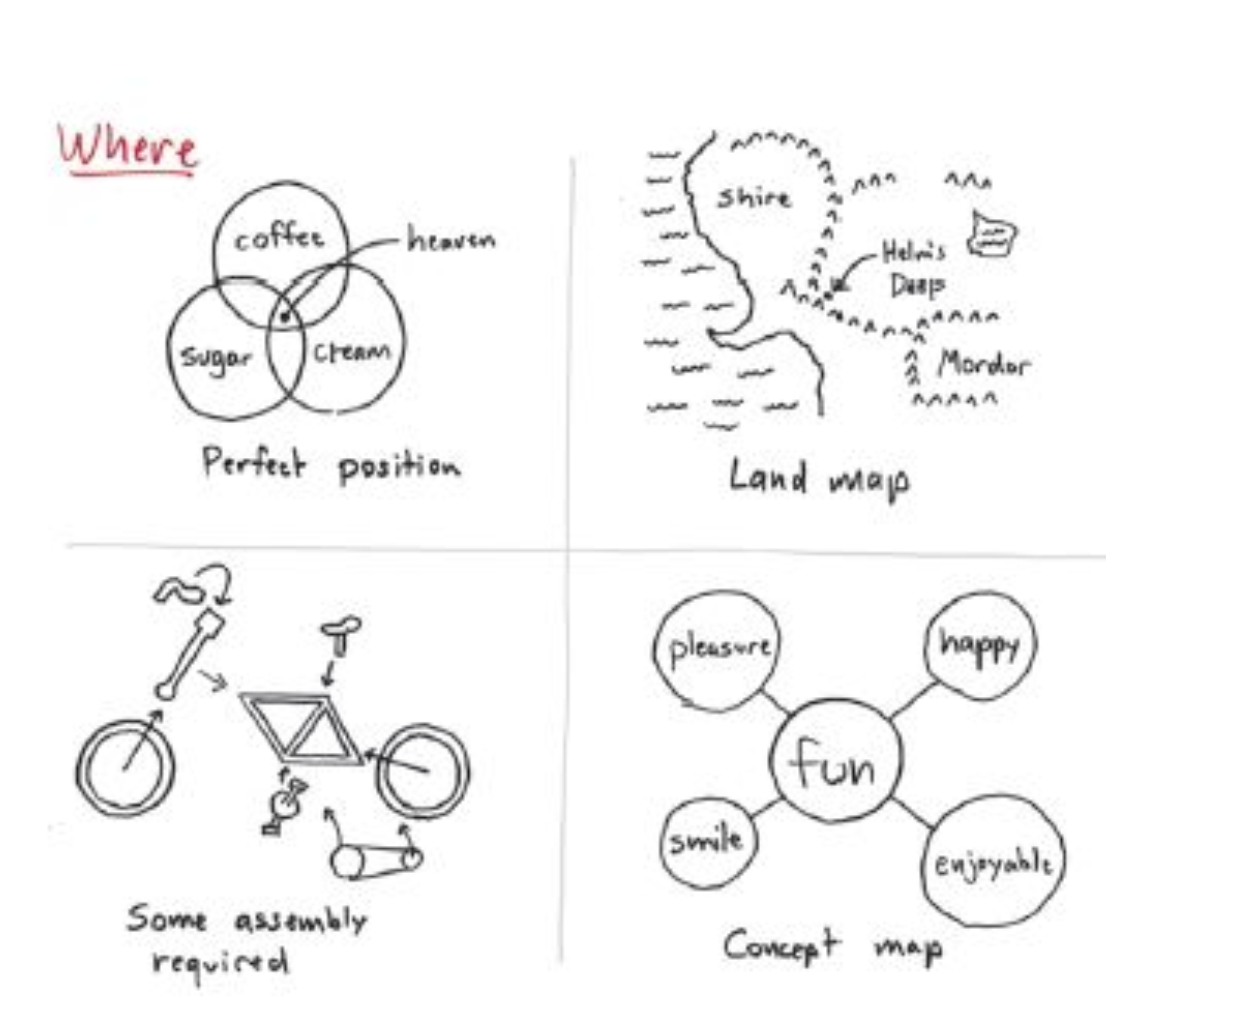
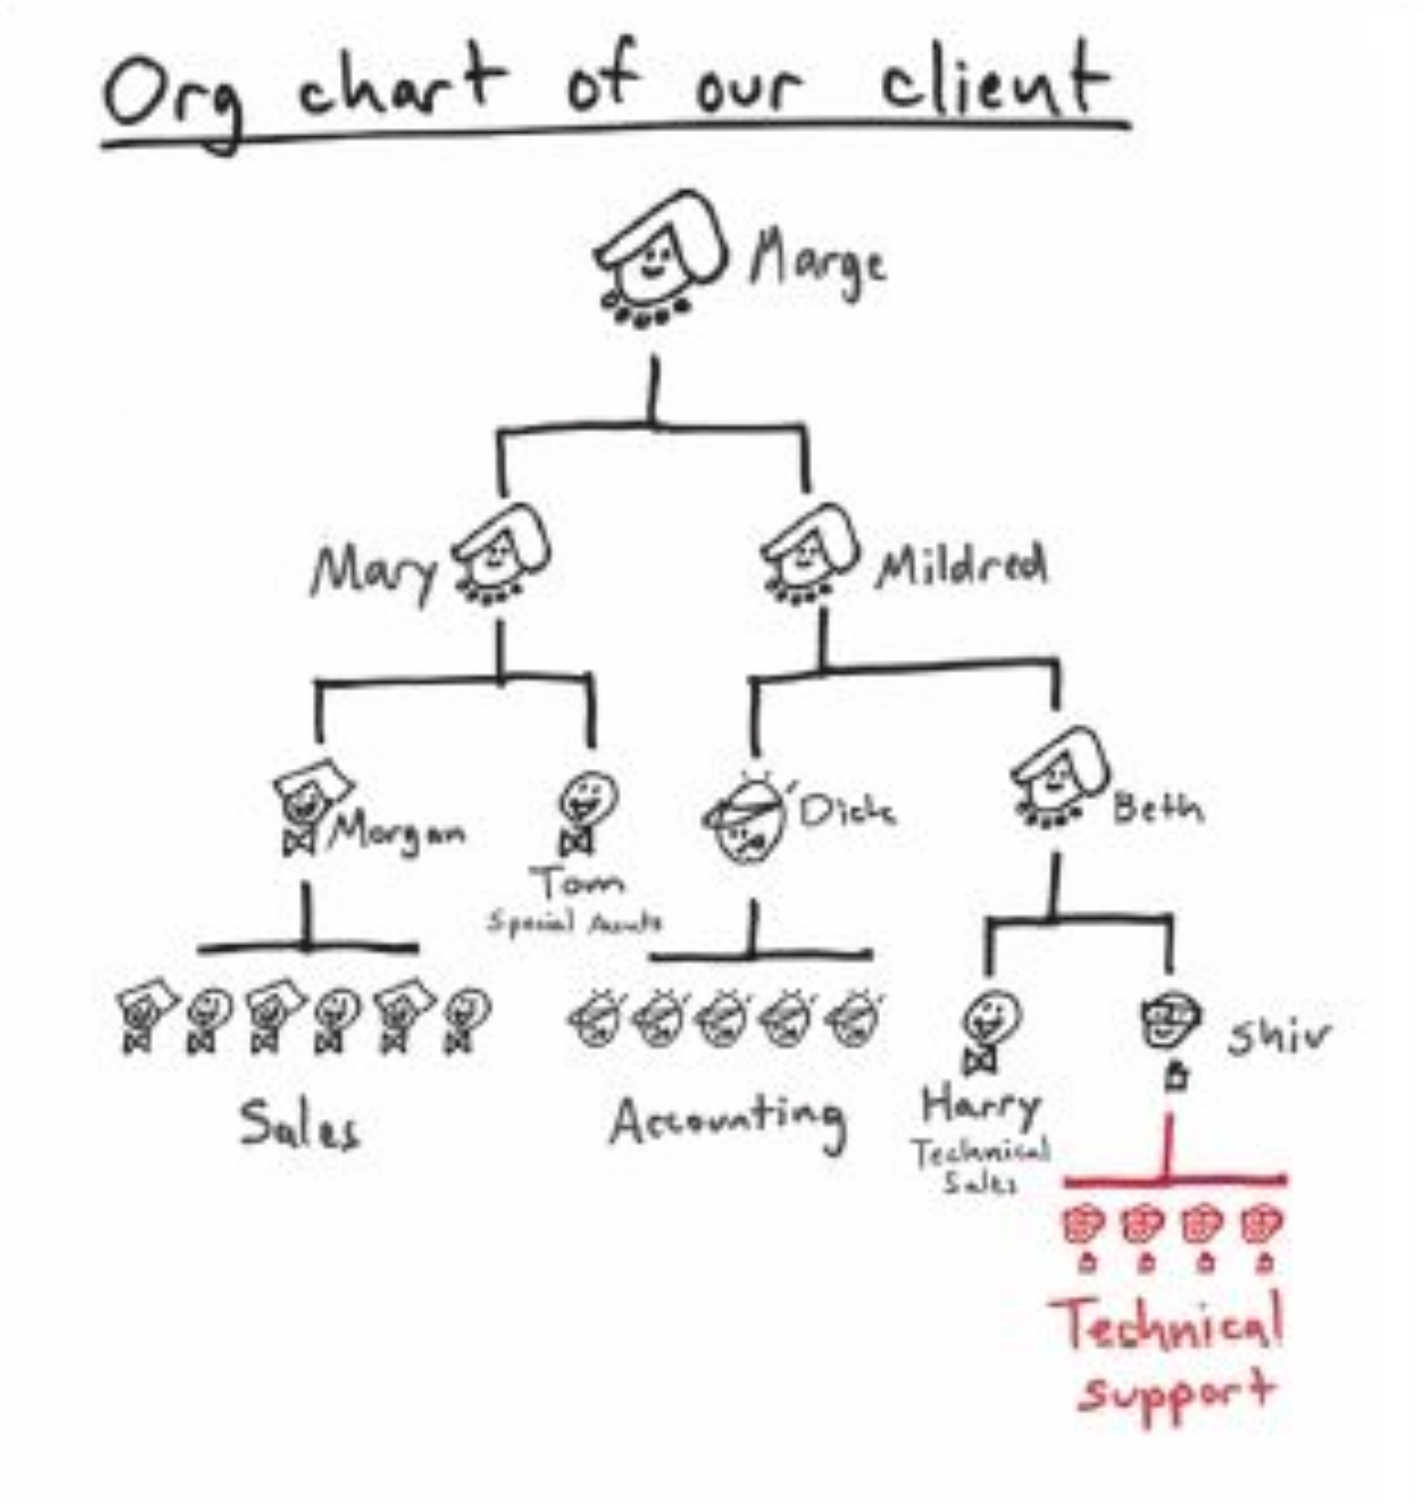
- Maps: When explaining the relationship of one object to another, Roam recommends you use a map. When I think of maps, I tend to think of street maps. But that’s too narrow a definition. Maps can show all sorts of things. From Roam’s book, here’s one example that explains the relationship among objects:
Here’s another screen capture from Roam’s book that shows an organizational chart, which is just another type of map:
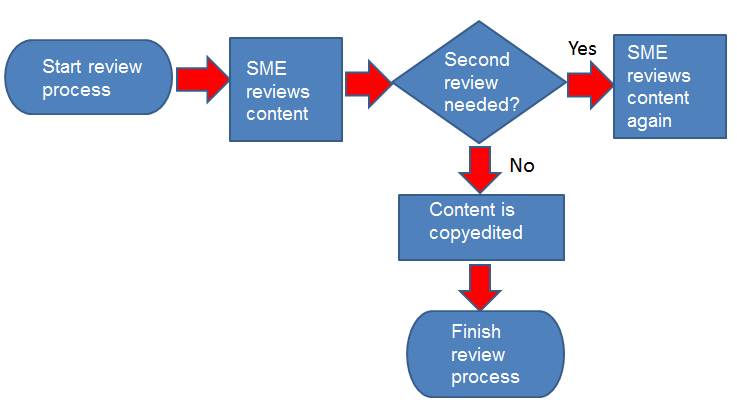
- Flowcharts: Flowcharts are tools that explain “how” a process works. If you’re serious about flowcharts, you could use Visio. For end-user documentation, I find Visio diagrams too technical looking and uninviting. I created this simple flowchart in PowerPoint that explains one way to review technical documents:
In this blog entry, I’ve just scratched the surface of Roam’s book. The Back of the Napkin is well worth a read for technical writers who want to diversify their skill set and use visual thinking to work through complex technical concepts.
 I have worked as a